Playground for graphics

Deferred rendering

During my experience in various commercial and non-commercial projects I’ve came across some interesting CG ideas, algorithms and approaches. Some of them I get to implement on those projects, some of those are already implemented and I just have to use them. Those that are left behind are still lingering in my mind with the label “I wanna do this”. That’s how I’ve decided to create a playground for myself.

First, it would be used to have slightly more organized (than regular drafty piece of code while trying something out) collection of various methods, tools and algorithms relating to 3D rendering and CG. Although it is way slower than just to bash some lines of code, but trying to fit methods I want into somewhat nice framework and pipeline is part of the task. In other words, it’s not really a playground, but more like a tool for myself, were I can play around with new CG and 3D stuff.

Another reason why I wanted to do this is to have a playground for shaders. There are plenty of shader authoring tools on the vast Internet, but I still haven’t found one that would fit my needs. At the moment I am using a set of ShaderMaker, Shader Toy and Shdr. Having my own environment suited for my style and needs is something I was misssing.

I’ve started it as a very simple “load and show” program. Since I had OBJ file loader implemented some time ago (here), I’ve started with using/adapting/adjusting the same code. And, implemented simple Phong shading with forward rendering using OpenGL. I did some more stuff on top of that, such as some GUI implementation, some abstract classes to support extensibility to some sort, etc.

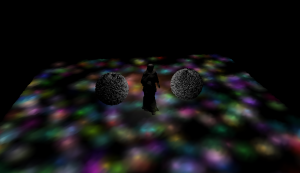
Finally, as my next step (and one of those “I wanna do it”), I’ve started with deferred rendering. And I had my ups and downs. Idea is extremely simply. But it took me a lot of time to figure out and find that rendering empty vector of light objects results in empty/dark scene. Stupid me. Anyways, picture above is current screenshot of my test scene rendered with 500+ point lights and couple of objects. This is still not optimized version of the algorithm so frametimes are just around 15ms.

Coming up next: the shadow! Probably. Well, first I will optimize the rendering and then most likely will want to go for shadows. Or some spotlight implementation and some other cool stuff related to that. Argh, so much stuff, so little time… 🙂

Tiny Tools To Turbocharge Thy Transistors

I have decided to post a list of a certain freeware (usually at least for personal/non-commercial use) software that I am using or have ever used. I will probably exclude all the fancy and popular enough software tools such as Dropbox or Evernote which might be already known.

The reason is that sometimes you have no idea that you can do something efficiently or more comfortably, thus you never consider looking for the solution. That’s how most of the time I’ve got hold of all these programs. Continue reading

Network I/O Graph

Some time ago I’ve encountered a need of tracking current utilization of my network interface. Just to diagnose if I am running out of throughput or network is weirdly slow. After short search, I found a neat freeware tool – NetSpeedMonitor – which would display a small “gadget” on the taskbar with current used throughput on selected network interface. It is quite customizable – selecting scale of measurements (bytes/kilobytes/kibibytes/etc), labeling differently and adjusting the look’n’feel of the aforementioned “gadget” (I am quoting “gadget” because it is NOT regular Windows Gadget. Nor it is just system tray icon.)

Furthermore, it does not only shows the current utilization, it collects statistics on how much data you actually sent/received on selected interface. It can monitor only one interface at the same time, but technically it is possible to switch and “monitor” any and all interfaces, as long as not several at the same time.
So, I have been using it for some time and I have quite a lot of data at the moment and I was wondering – why not to put it into charts? That should look cool 😀 So, here it is, my first digital traffic statistics 🙂

Conclusions

I was kind of aware of my probable maximum and minimum daily throughput. I was actually surprised on my “average” statistics. I am really wondering how it adds up to 15 gigabytes of data per day on average… Of course, it might be the fact that data is not very “smooth”, and dispersion is enormous… Maybe those several days with outrageous traffic mess everything up 🙂 Let’s wait for more data…

N.B. #1 Although it might not be 100% accurate because I was monitoring only my WiFi interface (and not the Cable interface), but I have used WiFi almost all the time and probably Cable connection would be a fraction of a percent of overall traffic.

N.B. #2 The tool for generating those awesome HTML5/JS charts is from here http://www.highcharts.com/. Although I kind of lazily implemented it in my blog… (shame on me)

Packer2D

Once I was trying to make something from plywood and I had to cut a lot of rectangular pieces. I didn’t want to go blind and draw all the pieces on the plywood randomly, thus I’ve created this small program to try to find not the best, but at least better solution to my problem. Because I wrote this “tool” for myself, no user interface or anything else. That’s why source is available, too 🙂

Packer2D
Packer2D source